Spatially register the two STARmap PLUS sections using rigid transformation with the ICP algorithm
[1]:
import pandas as pd
import numpy as np
import scanpy as sc
import anndata as ad
import umap
import os
import matplotlib.pyplot as plt
import matplotlib as mpl
from matplotlib.cm import get_cmap

import INSPIRE
Load results
[2]:
res_path = "/gpfs/gibbs/pi/zhao/jz874/project/jiazhao/inspire_revision/tutorials/spatial_alignment/STARmapPLUS"
adata = sc.read_h5ad(res_path + "/adata_inspire.h5ad")
Step 1: Register section 1 onto section 2 using rigid transformation with MNNs
[3]:
adata_0 = adata[adata.obs["slice"].values.astype(str)=="1", :]
adata_1 = adata[adata.obs["slice"].values.astype(str)=="0", :]

loc0 = adata_0.obsm["spatial"]
loc1 = adata_1.obsm["spatial"]

latent_0 = adata_0.obsm['latent']
latent_1 = adata_1.obsm['latent']

loc0_registered = INSPIRE.utils.rigid_registration_MNNs(latent_0=latent_0, # latent representations of cells or spots from section 1
                                                        latent_1=latent_1, # latent representations of cells or spots from section 2
                                                        loc0=loc0, # spatial coordinates of cells or spots from section 1
                                                        loc1=loc1, # spatial coordinates of cells or spots from section 2
                                                        k=1, # number of MNNs
                                                        metric='euclidean', # metric used for computing MNNs
                                                        filter_quantile=0.5, # quantile threshold for filtering out low-quality MNNs
                                                       )

adata_0.obsm["loc_aligned"] = loc0_registered
adata_1.obsm["loc_aligned"] = loc1
Step 2: Register section 1 onto section 2 with the ICP algorithm guided by landmark spatial factors
[4]:
key_factors = ["spatial factor 2", "spatial factor 4", "spatial factor 9", "spatial factor 8"]
[5]:
loc0_registered = INSPIRE.utils.rigid_registration_ICP_landmark_factors(
    adata_0=adata_0, # anndata object containing results for section 1
    adata_1=adata_1, # anndata object containing results for section 2
    loc_0=adata_0.obsm["loc_aligned"], # spatial coordinates of cells or spots from section 1
    loc_1=adata_1.obsm["loc_aligned"], # spatial coordinates of cells or spots from section 2
    landmark_factors=key_factors, # user selected landmark spatial factors
    factor_value_threshold=0.6, # threshold for selecting landmark factor-related cells or spots
    plot=True, # whether to draw plot or not
    spot_size=100, # spot size in plots
)


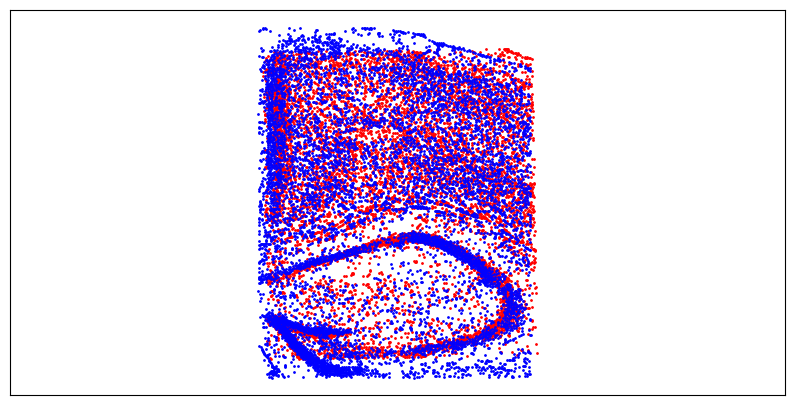
Registration result visualization
[6]:
f = plt.figure(figsize=(10,5))
ax = f.add_subplot(1,1,1)
ax.axis('equal')
ax.scatter(loc0_registered[:,0], -loc0_registered[:,1], c="red", s=1)
ax.scatter(loc1[:,0], -loc1[:,1], c="blue", s=1)
ax.tick_params(axis='both',bottom=False, top=False, left=False, right=False, labelleft=False, labelbottom=False, grid_alpha=0)
plt.show()
[ ]: